.png?width=150&height=61&name=explori_logo%20(1).png)
Paving the Way to Higher Impact Expos with Event Data
How successfully are exhibitors connecting with qualified contacts? Are attendees finding the partners and suppliers they need?
The answers to each of these questions rely on data, and the ability to deliver high-impact experiences to stakeholders depends on an event strategist’s ability to measure and interpret it.
Measuring the impact of each event component offers a view to how both exhibitors and attendees experience an event, and tracking this data over time lends itself to better and more financially attractive events from one year to the next.
Event organisers often track engagement and satisfaction across their stakeholders with simple post-event feedback tools, but there remains a lot of pandemic-related uncertainty around travel and the market is becoming more competitive. Associations and exhibition organizers are under increasing pressure both to deliver value and to substantiate it to exhibiting partners, sponsors, and other stakeholders.
Measuring and benchmarking events and event components is essential to meeting that challenge.
Avoiding Stagnation (or Worse)
It may be tempting for long-running shows to treat a pattern of revenue growth as the rule. ‘We’ve been growing 3-5% per year for 10 years,’ they might say, ‘so we have nothing to worry about.’
The trouble with neglecting to measure things like satisfaction and impact on an ongoing basis is that organizers run the risk of missing changes in the market that might undermine a pattern of growth or positive impact.
The crux of the problem lies in relying too heavily on lagging indicators. For example, let’s say you run an annual conference and expo that serves as a mainstay for your industry. If you’re plotting your revenue from year to year on a graph, you may see a comforting incline maintained by a loyal base. But if you’re not also tracking how actively satisfied that base is at every iteration of the event, you may not be picking up on pain points that need addressing -- or worse, a rising sense of discontent.
What if a segment of the attendees wasn’t able to make relevant connections this year? What if they found the show less navigable for some reason? What if the exhibitors found the audience less qualified and the deals less lucrative?
What if both camps simply come every year because they don’t feel they have another comparable option?
In a world where exhibitors are increasingly prioritizing a highly qualified audience over sheer volume and customers are increasingly prioritizing highly curated, high-value experiences, show organizers can no longer afford to rest on the laurels of prior success.
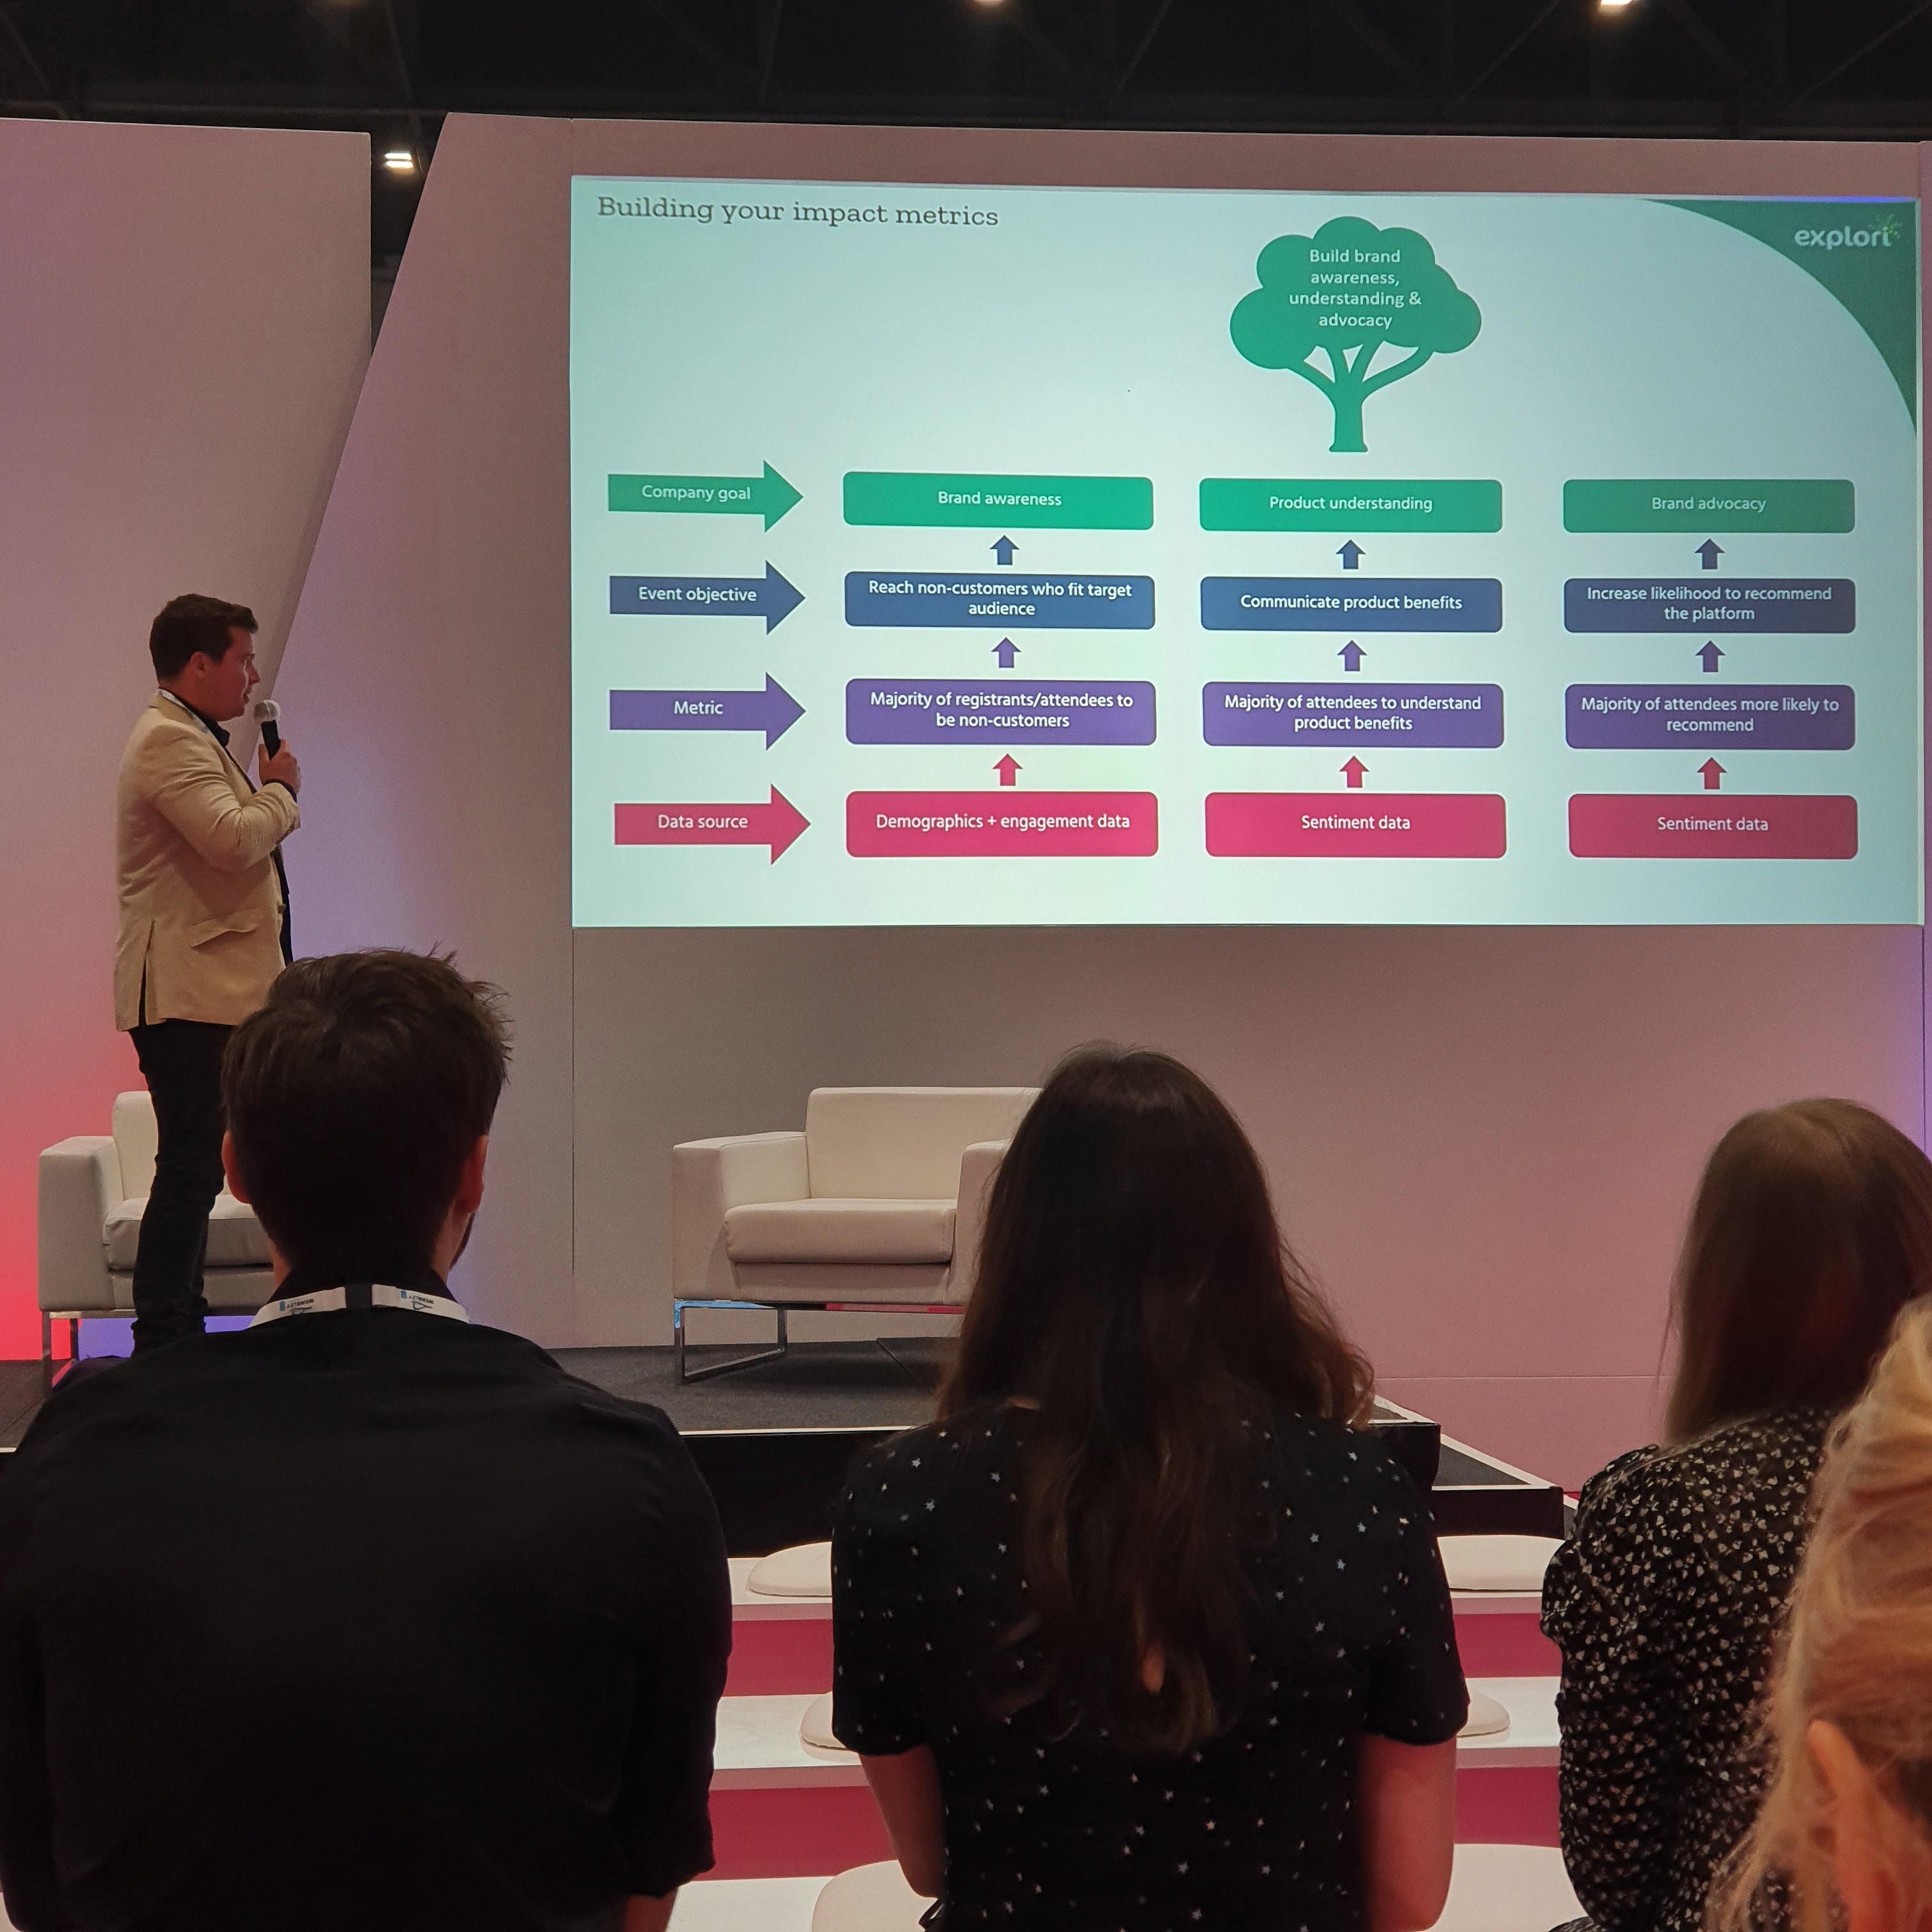
Intentional Data Mining Across the Customer Journey
Gathering data across the attendee journey allows exhibition organizers to determine which steps of the journey drive value and which contain bottlenecks or pain points that need to be addressed. Understanding both is essential for ensuring a positive experience that continues to meet (or ideally exceed) stakeholder expectations over time and motivates the right behaviour at and after the event.
There are plenty of tools in an organizer’s arsenal for tracking engagement and sentiment. These include surveys, social media engagement, polls, and analytics built into registration and other platforms.
Sophie Holt, managing director of Explori, advises that organizers “consider which data sources will tell you the who, the what, and most importantly, the why?” in order to derive meaningful, actionable insights from event data.
Being intentional about what you want to discover will help to set you up to track the right data points. For example, if you want to measure exhibitor satisfaction, purely looking at the number of leads generated is only one piece of the puzzle. Generating fewer leads at a higher conversion rate can be preferable to coming away with a higher volume that doesn’t amount to any revenue.
Similarly, a high registration rate does not necessarily translate to a successful event or happy sponsors and exhibitors if it isn’t proportionally reflected in brand engagement. Only through tracking both registrations, engagement, and ultimately conversions will you gain perspective on the real value to each stakeholder category. Why might brand engagement have been subpar? Perhaps the show floor layout was suboptimal. Perhaps matchmaking could have been better utilized. Perhaps key brand activations were scheduled at times that competed with one another.
Using the tools available to gather both quantitative usage and engagement data as well as qualitative feedback is the best way to discern these issues and ensure that an event maximizes its impact and drives desired outcomes for both members and exhibitors.
You Have the Data; How Do You Know If You Did Well?
“Using integrated research tools to benchmark an event’s success over time and against competitors allows a narrative to be drawn out of the data,” says Holt.
Ultimately, it’s up to each organization to establish its own objectives and success metrics, but there are a number of common key performance indicators that are fit for purpose. The Net Promoter Score (NPS) is perhaps the most common. Derived from the disposition of your attendees (or exhibitors) to recommend the event on a scale of 1 to 10, an event’s NPS is a fairly clear indicator of success. That said, NPS surveys should include an opportunity for qualitative feedback to facilitate actionable insights. It may even be worth personally following up with outliers that give an event an especially low score.
Holt points out that “being able to demonstrate to attendees that their feedback has been listened to, and what steps have been put in place to address any concerns, is incredibly powerful” when it comes to engaging members and, ultimately, delivering greater value. This will also help to develop a sense of community around an event as it conveys a sense of influence over how the event evolves; listening to and actioning feedback underscores an organization’s commitment to serve the member community.
But directly asking attendees and other stakeholders how much they liked the event only offers one piece of the puzzle. A more comprehensive analysis involves an array of data from a variety of sources. Text analysis from social media sources, engagement data on virtual platforms and event apps, and longer qualifying surveys all contribute to the bigger picture.
However, a challenge many organizers face when collating that data is an inability to reconcile it across a single event, nevermind a whole annual event program. Inconsistent data formats on the part of disparate tools and systems makes it rather difficult to compare events.
One way to side-step this issue is to set top-down survey standards for collecting attendee and exhibitor feedback. Asking questions in a consistent format with consistent language across all events reduces the guesswork and interpretive lift when comparing one event to another. In this way, it makes it a lot easier to establish benchmarks as well -- and benchmarks are the ultimate goal for measuring progress in your event’s impact.
Whereas a trend of moderate increases in revenue can come from a number of mechanisms (increasing ticket prices, higher volume registrations), the trend of consistent improvement in the user experience is what leads to a legacy of meeting objectives and changing behaviour -- in other words, value.
While internal benchmarks give associations insight into how well their events are doing relative to other events they’re putting on, the same principle can be extrapolated for all the events within a given industry. In other words, your fall conference might be doing better than your spring conference, but only through industry benchmarks can you know how well either are doing in a more objective sense.
Operating with established industry data conventions allows you to tap into insights that go beyond your specific organization’s event portfolio. Not only does it streamline the process for collecting feedback by somewhat answering the question of what to ask your stakeholders for you, but it allows the data you get back to stand apples to apples against the industry standard.
Intentionally gathering and analysing data in consistent formats allows conference and exhibition organizers to not only demonstrate the strategic impact of their events, but to determine how they fare against the rest of the market.
Want to find out more? The Event Impact Playbook which aims to help event organisers measure the impact of events so that they can underpin their next strategic event is available to download for free here.