.png?width=150&height=61&name=explori_logo%20(1).png)
On a scale of 0-10, how likely are you to recommend this article to a friend or colleague?
Don’t answer that question – not before you’ve had a chance to read the article, anyway. To most of you, the format of the question above will be familiar in some way, either because you’ve seen something like it in a feedback survey or because you’ve made use of the Net Promotor Score (NPS) metric in a professional context.
This year, the venerable NPS turns 20. Created (and trademarked) by management consultancy guru Fred Reichheld in 2003, NPS is a simple metric used in industries of all kinds to evaluate the performance of products and services. At Explori, we use NPS to measure the performance of corporate events, such as trade shows or conferences. In essence, it is designed to measure how likely a given product or service is to be recommended by its users, on a scale of 0-10.
Those giving a score of 9 or 10 are classified as Promoters, who are extremely likely to recommend the product in question, while those giving a score of 0-6 are Detractors. The in-betweens are known as Passives. NPS is calculated by subtracting the proportion of Detractors from the proportion of Promoters, to give a score that can fall anywhere between +100 and -100.
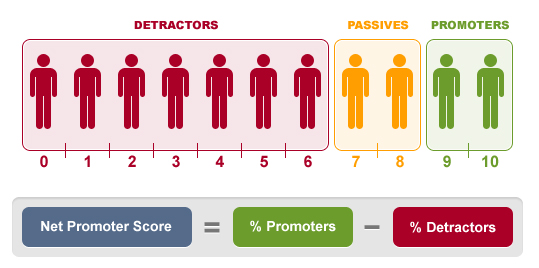 Source: checkmarket.com
The enduring popularity of the NPS metric likely lies in its simplicity and versatility; it is applicable to all kinds of things, from events to tech products, and the data is easy to obtain through customer surveys and straightforward for respondents to provide. Consider how often recommendation plays a role in the decision to try – or not try – something new: a friend’s enthusiastic review of a film they just saw; a sub-4-star Trip Advisor rating for a restaurant; a colleague telling you that a particular trade show is not to be missed. Recommendations are crucial for growth, and this is exactly what the NPS seeks to measure.
It’s worth keeping an eye on the detail behind the consolidated NPS figure, however. A range of different outcomes can produce the same score; for example, an NPS of 20 for an event could comprise all three of the following scenarios:
.png?width=1440&height=600&name=Hero%20(14).png)
The example above illustrates why NPS should not be considered in isolation from other metrics. To truly understand an event’s performance, additional data points are required. At Explori, we collect data from post-event surveys to create four key metrics for our clients: NPS, overall satisfaction, event loyalty (i.e. likelihood of return), and event importance.
Used in conjunction with NPS, these three additional metrics provide event professionals with a deeper understanding of how participants really feel about an event. Did attendees get everything they wanted out of the event, overall? Will the Passives return next year, even if they are unlikely to convert colleagues into attendees? Is it the industry event – or just one good option among many?
These event metrics are indicators of not only how an event has performed on specific occasions, but how resilient the event is. Unlike metrics such as attendance and revenue, lagging indicators which tell us only about an event’s past performance, these four metrics are leading indicators, telling us something about how the event is likely to perform in the future, and alerting the organiser to potential red flags – or, in the best-case scenario, telling them to keep doing what they’re doing, because it’s working!
All four metrics are combined by Explori into a single event measurement score, which provides a simple way for senior leadership to check in on the performance of their organisation’s events. For those more invested in the specifics, the four metrics that make up the event score are presented alongside plenty of other data points and feedback from event participants, helping event professionals to set the direction for future events and further growth.
In a vacuum, however, the data from a specific event doesn’t tell you everything you need to know. You received an NPS of 30: is that good news? Well, it all depends on the context. You’ll want to know how the score compares:
- To previous iterations of the event
- To similar events organized by your company
- To similar events organized by other companies
At Explori, we have surveyed participants at thousands of trade shows, amassing a wealth of event data. Crucially, each of these surveys collects the data required to create a score for each of the four metrics outlined earlier in the article, including NPS. This means we are able to supply our clients with the relevant context in the form of event, company, and industry benchmarks for their event data, enabling them to holistically evaluate the performance of their event in relation to the wider industry. For more information about event data strategies, watch our video here...
.png?width=797&height=138&name=Hero%20(16).png)
By now, it should be clear that NPS is a crucial part of the picture – thank you, Fred Reichheld! – but it’s not the whole picture. So, as this article wraps up, we’d like to ask you:
On a scale of 0-10, how likely are you to recommend this article to a friend or colleague?
Additionally:
How satisfied are you with this article?
How likely are you to read another article on this blog?
How important is this article to your business?
Here’s to 20 more years of the NPS!
.png?width=500&height=540&name=Group%20160852%20(1).png)
Explori is powering the events industry with the right data and insights.