Explori Blog
Updates, announcements and articles you need from the Explori—all in one place.
Global study reveals optimism for trade shows
Oct 23, 2020
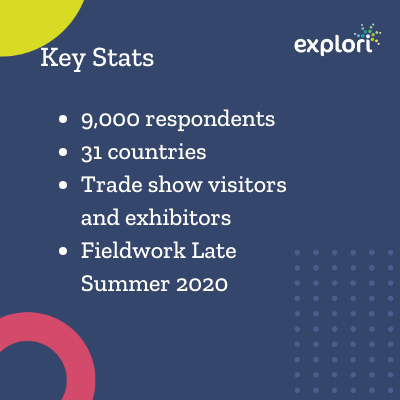
Having just released the full Global Recovery Insights report, produced in partnership with UFI and supported by SISO, project lead, Sophie Holt, takes us through the key findings of the priorities of our visitors and exhibitors as live events start to return. When we embarked on this project, as lockdown commenced this spring, I was apprehensive as to what we would find. At the end of 2019 we had produced the Global Exhibitor Insights, which made somewhat uncomfortable reading for the industry. It highlighted that some exhibitors were beginning to have concerns about the ROI of live events and question some of the figures that organisers were publishing. Add to that, the biggest disruption that many of us have ever experienced in our careers and some commentators were suggesting that our industry was on a knife edge, facing a fundamental shift away from live events. It was possible that we were about to produce research that could spell dark times for our industry. But as we analysed the results in late August, it was clear that there was much to be positive about. Not only were live events being sorely missed by both visitors and exhibitors, it seems that they have not found alternative channels that can replace the unique aspects of face-to-face networking. Live events support business generation: Two thirds of those who exhibit at trade shows reported their cancellation has had a notable detrimental impact on their business, reducing their ability to build awareness with their target markets. 50% of companies reported that the absence of live events was negatively affecting their ability to generate new business. And whilst our current visitors and exhibitors strongly prefer live events across every aspect, there were also intriguing hints as to the future of digital and hybrid events, which I will cover in a future article. What does the future look like? Both visitors and exhibitors reported some drop in how frequently they planned to attend live events in future compared to previous studies we have conducted. But when compared with data from 2019, the drop for exhibitors was very modest. This reduction in frequency seems to be part of a more long term trend where exhibitors in markets where the exhibition industry is very developed are planning to level out their participation. The more pronounced impact on visitor attendance is driven by short term concerns, primarily around safety. Visitors who were planning to reduce their attendance need to be reassured that robust safety measures are in place. They are also more drawn to the option of being able to attend an event digitally, for the time being at least. When will spend return? Possibly the most encouraging aspect of the study was exhibitors still feeling confident about the return of their spend for trade shows. 28% of exhibitors said their spend would return to pre-Covid levels as soon as live events were running again. Only 13% felt the drop in spend could be permanent. On average, exhibitor spending could return to pre-Covid levels within 11 months. This held true across widely differing sectors and countries. Whilst as of August, budgets for other marketing channels remained relatively unaffected, unsurprisingly there has been a big impact on spend planned for live events. Both trade show budgets and in-house event budgets have been cut on average by 50% at this time. It will be interesting to see how this survives contact with CFOs as planning for 2021 crystalises. But will these budget cuts manifest themselves in shows being dropped from a trade show marketer’s plans, or an overall belt-tightening? The picture is complex. Whilst we can definitely see that the more severe the budget cut, the more likely an exhibitor is to reduce the number of shows they support, it is also true that, even for companies experiencing the largest cuts to their trade show budgets (in excess of 50%) they are still equally likely to continue to exhibit as frequently as to start dropping shows. What is drawing audiences back to live? This study has confirmed that building connections by networking is a unique aspect of live events, that has yet to be effectively replicated by other channels. Two thirds of both visitors and exhibitors have experienced fewer networking opportunities whilst there have been no live events. This translated into fewer leads generated for businesses (48%) and ultimately lower sales (45%). Digital events are not currently filling this gap, with “quality of networking” being the area they scored most poorly in comparison to live events with only 8% of exhibitors feeling that digital could compete with live. Whilst our audience is supportive of sensible health and safety measures, they are reluctant to accept any measures that impede their ability to network, telling us that any reduction on social and networking activity reduces their likelihood to attend an event. This presents a challenge for organisers and venues alike. How can we offer high quality interaction whilst still following Covid Secure guidelines? And how can we offer an equivalent networking experience to our visitors who currently want to participate virtually? I’m sure many innovative solutions will emerge. Quality vs. quantity? We wanted to know what factors organisers should prioritise to ensure their show was a “must attend”. Here our respondents were unequivocal. They will be evaluating shows based on the quality of the visitors and exhibitors. Whilst visitor quality has always been an important factor for exhibitors, we can now see that it far exceeds the importance of visitor numbers, with 58% of exhibitors thinking it a priority for organisers vs. only 38% who were concerned about numbers. Exhibitors appreciate that visitor numbers may be restricted for a period of time, so they want to ensure that those they do meet are both relevant and purchase-ready. Interestingly, we also see exhibitor quality emerge for the first time as a critical factor driving visitor attendance. Where previously, we might have seen quality of education and content being the biggest factor, with 34% motivated by exhibitor quality vs only 14% motivated by high quality education, this is an interesting shift. Again we can see the unique aspects of live events at play; the ability to meet the most relevant suppliers in one place, being seen as much more important than education, an objective which can potentially be achieved elsewhere. For the first time, cost of attending has also emerged a decision factor for visitors, with 39% citing it as a priority. This in part may be driven by pressure on travel budgets, but it can also be seen in the context of the availability of digital events, which visitors recognise can now provide them with high quality content at the fraction of the cost of attending in person. Future insight plans As the situation is constantly evolving, both in terms of access to live events and uptake of digital events, we asked participating organisers to reserve a portion of their data to allow for a second phase of research beginning December 2020. The first report is now available for UFI members via gri@ufi.org Other verified trade show organisers and venues can request a copy here Sophie Holt, Managing Director, Explori This article first appeared in Exhibition World
Are your virtual events fulfilling their objectives?
Sep 25, 2020
At the beginning of the pandemic, event profs were in firefighting mode and worried about the impact it would have on their jobs.Though in some parts of the world live events have returned, many other countries are still stunted by government and travel restrictions. The ‘pivot’ to virtual was a swift one with many rising to the occasion. Planners were forced to learn by doing. Whilst some of these early experiments failed the result has been the creation of some exceptional online events which demonstrate the core value of events; delivering unforgettable experiences. I attended my first hybrid event in July. An event I have been desperate to attend for years but could never quite stump up the money to go. They were going hybrid with a 4-day, 12-hour long conference and I was not going to miss it. What made that experience so engaging that I stayed glued to my laptop for the entire conference? The energy of the presenters was palpable, the interaction with the audience, and seeing everyone’s videos on those curved IMAX screens. Every hour we got up and jumped up and down to some music so our bodies and brains didn’t fall asleep (sorry downstairs neighbours). And just like that a 4-day, 12-hour long conference came and went and I closed my laptop feeling energised (said no one ever after a 4-day conference!) Being the event nerd that I am, I left that event wondering... What purpose/goal/mission were the organisers pursuing when they decided to take the risk of running this event? Were they looking to drive sales, raise brand awareness, increase brand affinity? I felt I had met my objectives but how could they, or any other organiser, measure my energy and excitement to understand whether or not the event had fulfilled its stated purpose? They did some up-selling where they provided an opportunity for attendees to purchase another course. This could have been the main objective for putting on the event. But not signing up for the upgrade doesn’t mean I had a bad experience. Therefore the organiser might look to my willingness to refer. They can measure my likelihood to recommend the event to family and friends using the popular Net Promoter Score. But again it doesn’t give the organiser a complete picture of my experience and the overall impact of the event. So what will? Here are 3 ways you can distil the experience of your attendees into metrics from Explori’s free Event Impact Playbook. If you want to get to the heart of your attendee’s experience you should try to measure these three things in your feedback survey: Cognitive impact Impact on sentiment Behavioural intention Cognitive impact What is the change in knowledge and understanding we would like to happen as a result of our event? Cognitive feedback questions will help you understand if your event succeeded in delivering the main communication points ie. the new features of a product. Did the necessary knowledge transfer occur? Impact on sentiment How should attendees feel after they leave our event? Sentiment feedback questions provide the perfect opportunity to learn how your event has impacted brand perception. Do attendees feel like your company cares about the needs of its customers and employees? Or do they agree that your brand embodies the core values it promotes? Behavioural intention What is the behaviour we intend attendees to take as a result of attending our event? This is particularly important for events which are part of a long communications/sales cycle. Within a week of the event you’re able to understand what behaviours your event has influenced. Are attendees more likely to purchase, remain employed or recommend your product/service? Behavioural intention is where you see the tangible value of your events for your business. Let’s look at this in the context of my first virtual/hybrid event experience. Just because I didn’t upgrade to the next course doesn’t mean the organiser failed in their objective. If they measured my behavioural intention they would be able to see that I intend to participate in their next live event. Through my sentiment score they would discover that I absolutely agree the company helps individuals and businesses succeed. And my cognitive score would highlight they had successfully communicated the message that ‘everything you need to succeed is already within.’ There is so much more when it comes to measuring attendee experience that I haven’t shared here. And if you’ve read so far into this article, please tag a friend or colleague who you think would find it interesting/useful. For a full list of attendee experience metrics you can measure for your next virtual/hybrid event, download the free Event Impact Playbook
Latest trade show stats shared via UFI Connects Webinar
Sep 9, 2020
Explori have shared the results of their latest study into the recovery of business events, via the UFI Connects Webinar Series. Global Strategy Director, Sophie Holt led the session, sharing the views of over 9,000 trade show visitors and exhibitors on the recovery of live events. Topics covered included: The business impact of event cancellation on visitors and exhibitors The importance of social interaction for attracting people back to events How exhibitors might make decisions around where to spend and where to save In addition to the study insights, the session turned all the participants into a live "expert panel" drawing on expertise from round the world to share best practice as business events begin to re-open. A recording of the webinar is now available on-demand here: The full report will be released at the end of September, you can register to receive it here:
Positive findings released from global industry study
Aug 3, 2020
Today, the findings are released from an extensive global study on the recovery of the trade show industry. The study was conducted by live events research specialists, Explori in partnership with UFI, the global association of the exhibition industry and supported by SISO, the Society for Independent Show Organizers. The interim findings, comprising over 9,000 responses from 30 countries, have shown that the absence of business events is having a significant negative impact on companies who rely on them. Two thirds of those who exhibit at business events reported their cancellation has had a notable detrimental impact on their business, reducing their ability to build brand awareness with their target markets. Half of businesses expressed this impact as being “very large”. 50% of companies told researchers that the absence of live events was negatively affecting their ability to generate new business. Of those who come to business events as delegates, 90% felt they had been negatively impacted as a result of not being able to attend events. Nine out of ten felt that alternative solutions such as virtual events were not as effective in meeting their professional needs as live events. “With trade shows running safely in more markets around the world, we are starting to feel more positive as an industry. These results support that optimism, showing that the businesses who participate in our shows are missing the value that face-to-face brings and trade shows play a key role in driving economic recovery,” says Kai Hattendorf, UFI CEO. Sophie Holt, Global Strategy Director, Explori added: “When we embarked on this project, most markets were in lockdown and the outlook for the industry was uncertain. Some commentators felt that a shift away from live to virtual events would be a long-term outcome of the pandemic. However these results suggest that whilst virtual events have an important role to play, especially in bringing events to new audiences, our customers are eager for the return of in-person events. We will be conducting a further phase of research in the near future to further understand the sentiments of visitors and exhibitors round the world as more markets open.” Further results from the study will be released in the coming weeks via the industry press and the UFI Connects webinar series. To register your interest in receiving a full copy of the report on release in September, please provide your details:
What is NPS and why should event professionals care?
Jun 12, 2020
So what exactly is a Net Promoter Score (NPS)? Developed by Bain & Company and Satmatrix, Net Promoter Score (NPS) is a way to understand a customer’s perception of your product or service. It’s widely used across many industries and allows different sectors to benchmark themselves against each other – for example event planners could use it to compare their performance to other events, or even to other service sectors like hospitality or banking. It is one of the most important questions we ask our clients to include in every post-event survey they conduct. It leverages advocacy – the likelihood to recommend to a friend or colleague – as a way of understanding many different drivers of perception including satisfaction, ease of customer journey and return on investment in a single question. Respondents, in this case event attendees or sponsors, are asked to rate how likely they are to recommend the event to a friend or colleague in the industry. This graph is an example of how respondents are categorised based on their response as Promoters, Passives or Detractors. Net Promoter Score is then calculated as the difference between the promoters and the detractors and is expressed on a scale from -100 to 100. So an event with a plus score has relatively more promoters than detractors, whilst an event with a negative score has more detractors. So why does this matter? The impact of NPS has been extensively researched across many industries. With a finite number of potential attendees and sponsors in most sectors, when advocacy is low, it will get harder and harder to attract new attendees and sponsors and the existing customers will be increasingly sensitive to any price rise and over time may even withdraw their support. It is an important “leading indicator” as to how your event might perform commercially in the future. Explori has conducted research with events around the world that shows a positive NPS from exhibitors and sponsors means an event is more likely to experience commercial growth in three key areas: Attendee numbers Exhibitor numbers Exhibitor revenue Interestingly events with a positive exhibitor NPS are growing their sponsor and exhibitor revenue faster than their exhibitor numbers, indicating they may also be finding it easier to up-sell their existing customers to new and higher value services. Want to know more about NPS and other aspects of event exhibitor and sponsor experience? You can download our full report here, covering the experience of exhibitors all round the world. NPS for virtual vs live events At Explori, we have been benchmarking attendee experience metrics including NPS for virtual events since March 2020 and the results are clear. Advocacy is higher for virtual events than for live events. The data indicates that attendees are more likely to recommend virtual events to their colleagues and friends. But we have to ask why that is? Are virtual events delivering a better experience than face-to-face events? It is highly likely that the reason virtual events are seeing a boost in their recommendations relative to live events is because of ease of access. There is much less heavy lifting involved with making a virtual recommendation. If you’re recommending an event halfway across the world that would require flying to another country, booking accommodation and taking time away from family and friends, you’ll probably want to make sure that is a must-attend event before making that recommendation. However if you are sending a colleague or friend a link that they can access from their computer in the comfort of their home it doesn’t require as much consideration past the point of the event providing good content. And this is just the tip of the iceberg with what we have been seeing in the data regarding virtual events experience. >>> Download our latest research on virtual events How to improve your event Net Promoter Score In some circles NPS is viewed as the holy grail of measuring attendee experience. Oftentimes it is the single metric monitored by event organisers to understand if their event is doing well. Though NPS is an important metric to measure, it is often better understood in the context of other key metrics, such as Overall Satisfaction. Overall satisfaction is highly correlated with NPS. If you measure attendee objectives and Overall Satisfaction in your post-event survey you can run a correlation analysis to discover which objectives are driving satisfaction at your event. By focusing attention on how to improve your satisfaction score you should see higher Net Promoter Scores for your events.
Talking Exhibitor ROI
Jun 12, 2020
How can trade show sales teams build trust and de-risk the exhibitor experience to give higher exhibitor ROI - new video... Explori joined Raoul from media sales training specialists, Flume Training to share some of our insights on what drives high exhibitor ROI and what event sales people can do to drive trust. This clip also includes one of the most surprising stats to emerge from Explori's global trade show insights... You can see more of Flume Training's courses and tips for event sales teams here.
Webinar:UFI Connects on Exhibitor Experience
May 28, 2020
The UFI Connect series of webinars draws together trade show experts from organisers and venues all round the world. This week, Sophie Holt, our Global Strategy Director joined the panel to share insights on trade show exhibitor experience... Focus on the exhibitor experience will be a key part of the live event industry's recovery. And of course ensure its future success. Explori's Global Strategy Director, Sophie Holt joined panellists from Clarion Events and Exhibit Media to share insights about exhibitor needs during the current crisis and in the wider context. This included data from our major Global Exhibitor Insights projects - the largest studies of exhibitor sentiment ever undertaken in the trade show industry. You can watch the full webinar on demand now.
Webinar: Leveraging data for digital revenue
May 22, 2020
How to use data to generate unique insight and high value sponsorship opportunities - webinar now on-demand... Audience data might be the most under-utilised resource available to trade show organisers. It has the potential to generate unique insight, compelling content and high value sponsorship opportunities. In partnership with sales training specialists, Flume, Explori are hosting this webinar to explore using data to drive revenue and add value throughout the sales process. This webinar is now available on-demand Aimed at strategic and commercial leads looking to maximise all the revenue available to them, this interactive session will discuss: Pounds or pennies - the components of a high value campaign Creating lead generation wins for sponsors Using insight to make every sales relationship more successful Transitioning shows from market serving to market making
Feedback surveys? Only for lovers or haters?
Apr 6, 2020
Whilst more and more event planners are turning to online surveys to gauge customer feedback, some still have concerns about the validity of the data if they are planning to use it to inform their event strategy - are they right? New clients sometimes ask us if people are only motivated to fill in online surveys if they’ve got something really good or really bad to say, missing the views of the “average” attendee. So what does the data say? Using a sample of 146,000 attendees who completed post-show surveys, from the database of over two and a half a million survey responses collected by Explori in the last 12 months, we examined the response to the question: how likely are you to recommend the event to a colleague / friend, to find the Net Promoter Scores (NPS). NPS response is divided into three categories: Those who give scores of 0-6 out of 10 are classed as detractors Scores of 7-8 are passives or neutral Scores of 9-10 are promoters In our sample, 11% fell in the detractor camp, 42% in the promoter band and 47% in the neutral or passive band. So there was certainly a large group of people with middle ground views who had chosen to give feedback. With almost a third of respondents sitting happily in the neutral camp, (with scores of 7 and 8) and another 15% “a little underwhelmed” with scores of 5 or 6, this group is more sizeable than both the “lovers” or the “haters”. When it comes to post-show online surveys, “Average Jo” is quite happy to give her opinion. Online surveys vs face-to-face But we also see more of a spread to the extremes of the scale, including 3.5% rating the show they attended as 0 or 1 out of 10. It is this group that can sometimes be under-represented in face-to-face surveys conducted during the event. By collecting your feedback online after the event, you have given your attendees the fullest possible time to form their opinion of the event. In this respect it could be argued that there is more validity to their response than one taken part-way through the experience. Think about the very direct feedback you get from your attendees (whether they will attend next year). Do you find their responses are more neutral (don’t know whether they will or not) at the beginning of the event and more polarised (they definitely will not) towards the end or shortly after the event? Which do you feel most represents their “true” opinion? Social nicety also comes into play. Many people temper their opinions when they are talking to a real person – an unconscious attempt to protect the feelings of the interviewer, or to appear a better person before them. This can particularly impact responses to questions around income, job seniority and attitude towards professional development, where some answers are perceived to be more socially desirable than others. It also buffers the results against very low NPS scores. In results published by a UK research agency*, it appeared not a single respondent had given a score of 0 when surveyed face-to-face. You could address the “nice-factor” by placing self-serve terminals at your event in an area you are confident will attract the full spectrum of your attendees, but the cost of build and loss of prime space can make this unappealing. So should you be concerned if there is a variance between the data you get online and the data you would get face to face? Well not if you compare apples with apples; if you consistently collect your data in the same way, you are not going to run into problems when you compare year-on-year. You should also look for data that has been collected in the same way if you are want to benchmark externally. You know your audience – are there any groups through demographic, or line of work not accessible through email? Or are you are looking for the views of a vital subsection of your audience? Then consider combining online and offline research to help you meet your objectives. Agencies with experience of both, or online platforms with offline partners, will be able to deliver both and work the data to give meaningful comparisons. So in conclusion, online surveys are cost effective and getting increasingly sophisticated at capturing the full opinion spectrum from lovers to haters and everyone in between. Their big sample sizes lend themselves to detailed analysis and comparisons of the experience of segments of your visitors and they eliminate the “human” bias. But you may well find you get differing responses between any research conducted at the show and online after the show. It would be limiting to see either as being the “true” opinions of your delegates – they both need to be treated in context when you are drawing conclusions and compared against appropriate benchmarks to help you turn your data into something meaningful to your event strategy. Find out more about how you can incorporate attendee feedback into your event strategy.
Setting measurable event objectives
Mar 6, 2020
In order to measure the success of your event you need to know what success looks like for you. For your team. For your organisation. This begins with establishing clear and measurable objectives. For example, imagine you are organising a prospecting event for a SaaS business. You have 300 people attending who have demonstrated interest in the product your company offers. What would you set your objectives as? The temptation might be to accept the event objective as increasing sales. However, for most B2B businesses the sales cycles are often long with many different touchpoints in between. The most meaningful objectives for event teams are ones that can be measured a few days after the event. These demonstrate the true value of the channel and are the most useful for ensuring your events meet the needs of attendees and stakeholders alike. So if not 'increase sales' what objectives should you consider setting instead? Events are often part of a wider campaign of activities. In this case there might be a number of things happening including sales training, online demos, outbound marketing and more that are impacting sales revenue. Metrics that events teams can measure is an attendee's intention following their presence at an event. How has the event shifted their intention to act following an event. This is where the Explori event impact tree comes into play. There are four parts to the Explori impact tree that helps organisers set measurable objectives that link back to their company objectives. Company goal This is the fruit of your tree. You wouldn't plant an apple tree and expect to grow oranges. Equally you wouldn't organise an event to contribute to increased sales if the aim was to impact on staff retention. Start with the end in mind and build all your metrics out from this point. Cognitive goal What do you want your attendees to know when they leave your event? This will differ if you are thinking about your trade show booth vs an internal training event. This helps you laser focus on what you are teaching your attendees. It might be about updating the sales team on a new product or feature or increasing your prospect's understanding of what problem your product/service solves. Sentiment goal How do you want your attendees to feel after your event? Sentiment objectives are where we begin to get into measuring brand affinity. This is a fantastic opportunity to understand how events are used to communicate brand values to attendees. i.e. how many attendees believe your company is a leader in eco-technology? Behavioural goal What do your attendees intend to do after the event? This is critical. As described at the beginning of this post often the success of an event hangs on the number of sales, subscriptions or partnerships that have resulted. This is often a flawed approach as there are several touch points involved which aren't within the control of an events lead. Setting a behavioural objective such as intention to remain an employee of your company or intention to participate in a follow up meeting are a better indicator of the usefulness of the events channel. Establishing the correct objectives for your event is the first step to successfully measure your events. And the great thing about this structure is it can be easily incorporated into your humble survey. By requesting quantifiable feedback from your events you'll be able to build powerful insights which highlight the value of the events channel to your company's core objectives. Take your learning further by downloading the Event Impact Playbook.
IMEX optimises first-time visitor experience
Nov 29, 2019
Welcoming over 15,000 attendees, IMEX America aims to help meeting and event planners create powerful connections. Their objective for IMEX America 2019 was to better understand the experience of their visitors and exhibitors in relation to other events in the industry. Explori are the largest provider of trade show benchmarks across measures that include. Net Promoter Score, overall satisfaction, loyalty, event importance and more. These metrics are anonymised and incorporated into Explori’s global benchmarking dataset which allows organisers to compare their own event scores against an industry benchmark. IMEX GROUP traditionally used SurveyMonkey to measure the performance of their events however they wanted to understand how their scores on key metrics including Net Promoter Score compared to the industry. With over 3,000 trade shows in its dataset, Explori is able to provide organisers with global benchmarking data. This empowers organisers like IMEX GROUP to understand how they compare to competitors and provide insights into how they can improve their event to get and stay ahead. Download the IMEX case study here Of the 3,000+ events Explori benchmark, IMEX America ranked in the 99th percentile for visitor satisfaction. This demonstrates that their visitor satisfaction places them in the top one percent of all the trade shows Explori measures. For exhibitor satisfaction they ranked in the top 16% of the Explori dataset. Visitor loyalty (as measured by likelihood of return) scored 4.11 and for exhibitors this was even higher at 4.40. Scores for visitor and exhibitor loyalty both came in higher than average for their industry. Net Promoter Score is the measure of attendees who would recommend IMEX America to a colleague or a friend is ranked on a scale of -100 to +100. The industry average for trade show visitors recorded by Explori is +9 and for exhibitors -17. IMEX America scored +61 and +23 respectively. These findings supported IMEX’s understanding that they were delivering a strong event that catered to the needs of both its exhibitors and visitors. Filtering survey results revealed even deeper insights. The IMEX America team wanted to understand which attendees weren’t having the best experience and how they could improve this in 2020. Lottie Elson Associate Director of Marketing at IMEX GROUP said, “Explori’s research team flagged up an interesting theme in our post-show results. First time buyers had lower satisfaction scores than others in our attendee population. By filtering the report based on this attendee profile we found that this audience wanted slightly different information on how to navigate and make the most of their time at the event. They also wanted opportunities to network with other first time visitors. This has been a very useful insight which we will be using to improve the experience of our first time visitor buyers in 2020. And thanks to Explori’s intuitive platform we will be able to easily compare the satisfaction of first time visitor buyers in 2020 to our 2019 scores to see if we have succeeded in achieving our goal.”
Consumerization of B2B events: The shifting priorities of attendees
Jun 6, 2019
One of the highlights of last month’s Experiential Marketing Summit in Las Vegas was a benchmark study revealed by Sparks and Event Marketer about the consumerization of B2B events. When I compared some of their findings to Explori’s Global Visitor Insights report a clear difference emerged. When people attend trade shows they have different event expectations compared to when they attend brand-led events. In the US trade shows are still one of the most profitable B2B media strategies, generating over $13.2bn revenue in 2018. But all events aren’t made equal, and the data suggests nor are the people who attend them. In the Sparks report, they surveyed attendees at brand-led events (i.e. Dreamforce, AdobeMax, Google I/O and more) to understand what today’s attendees want from B2B events. Consumerization came out top as being highly important. However, Explori’s Global Visitor Insights (GVI) 2018/19 report demonstrated something quite different. If you exhibit regularly at events, or organise your own shows, you'll probably be surprised by what the data suggests. What is consumerization in the context of events? Consumerization (or festivalization) is a megatrend that exploded on the B2B event scene in 2016/17. A stream of articles and reports cited the changing face of B2B events influenced by what was happening in the consumer events space. The growth of the experiential economy has created a convergence point for businesses and the creative industries. B2B professionals have been exposed to the high-end production of festival style events such as South by Southwest and now expect a certain level of fun and enjoyment from conferences. B2B events have been challenged to adopt creative elements from consumer events in order to engage an audience who are becoming more distracted and fractured. It does however beg the question, are there some cases in which incorporating consumer elements is not required? Could it even be detrimental? What does the data say about consumerization in B2B events? The Sparks report found that, “while a significant 68% of B2B brands see consumerization as an important trend, an even higher percentage of attendees (77%) feel consumerization is important.” The data here reveals that attendees of brand-led events want to have festival-style elements woven into their experience. It appears they go to these events, not only to be informed but to be entertained. A different picture emerges in the GVI report. We asked 13,000 trade show attendees if they would spend more time at shows that are more entertaining. Only 24% of people in developed countries agreed*. We also asked if they thought events should be more like festivals. The results showed a much lower interest in introducing consumer elements to the trade show experience compared to brand-led events. Even amongst the youngest cohort of our study. Only 36% of under 24s and 33% of 25-34s agreed trade shows should be more like festivals. This disparity surprised me at first. Why do the expectations of someone attending a trade show appear to be so different from when they attend a brand-led event? A deeper dive into the data revealed what drives this. The shifting priorities of event attendees In brand-led events, Sparks found that the top 3 priorities for attendees are: Education/Professional Development (73%) Networking (68%) See new products (55%) However, at trade shows we found the top 3 priorities are: To see new products and services (62%) To keep up to date with market trends (61%) Networking (50%) 59% of our respondents agreed that it didn’t matter whether or not trade shows were entertaining as long as they could achieve their business objectives. It appears that trade show attendees have quite clear cut goals when it comes to attending events. Fun is a “nice to have” but when it comes down to it, the real measure of success is whether or not they find the suppliers and solutions their business needs. On the other side, brand-led event attendees want to be educated and increase their network. They also want that to be wrapped in an experience that echoes consumer events with more unique event spaces, innovative environments, autonomy over how they learn and interact and more creative F&B. For event marketers/organisers utilising a mix of trade shows and brand-led events, this is something to bear in mind. If you’re hosting or sponsoring a brand-led event it may be more beneficial to focus on the experience of your event or stand in order to satisfy attendees who expect to be entertained. Alternatively if you’re exhibiting at a trade show you may want to strip back the experiential elements and focus on showcasing the product/service you offer in an innovative way to converge with attendee expectations. It’s not a one size fits all approach. It’s important to consider whether throwing in consumer elements across all your events, regardless of format is going to deliver the best return. In order to cultivate an event strategy that leaves a lasting impact; tap into the unique expectations of attendees and tailor your strategy to suit. Download the full Global Visitor Insights report here.
What can 13,000 Trade Show Visitors Tell Us?
Jan 16, 2019
We published the findings of our 2018/2019 Global Visitor Insights at the UFI Global Congress in St Petersburg. Produced in partnership with UFI, the Global Association of the Exhibition Industry and supported by the Society of Independent Show Organisers (SISO), the report represents the biggest ever global study of trade show visitor experience. In this article, first published in Exhibition World, report author, Sophie Holt discusses some of the findings... Overall the view of trade shows amongst our visitors is positive and stable. When we look at the Explori Global Benchmarks, which contain visitor feedback on over 1,600 trade shows, key indicators of visitor experience such as Net Promoter Score (NPS) have been stable over the last three years, at +5 in 2016 and now +7 in 2018 for trade show visitors. This is reflected in the responses to the survey; most visitors report trade shows are performing about the same, if not getting a little better. But is fatigue is setting in for some regions? We can see that visitors in markets where the trade show industry is more developed, such as Europe and North America, are more likely than visitors in developing markets to say trade shows are getting worse. 27% of visitors in North America think trade shows are getting worse, compared to only 14% in the Middle East and Africa. The most cited frustrations for visitors will be a familiar list to most organisers: seating, catering, parking and queuing. However, visitors with these frustrations generally like trade shows, find them beneficial and plan to attend them again in future. When we look at respondents who dislike trade shows and do not find them beneficial, they tell us about very different frustrations. Core drivers of visitor satisfaction Visitors with negative views are much more concerned about their ability to meet the right exhibitors. This supports the insight from the Explori global benchmarks, where we can map how closely different visitor objectives correlate with overall satisfaction. Again, we see that exhibitors are key to visitors meeting their most important objectives of “sourcing new products” and “staying up to date with market trends”. 29 show directors and senior marketers were interviewed to support the research. Many of them emphasised the importance of a seamless visitor experience and creating a “Wow-Factor” for audiences through tactics such as “festivalisation”. Organisers may be in danger of under-valuing the core role of the exhibitor in driving visitor satisfaction. This study allowed us to understand visitors’ overall views of trade shows as a channel to meet their business objectives. Again, the results were positive; across a range of business objectives, trade shows were the preferred channel ahead of social media, online market places and trade publications. Whilst visitors are most likely to see trade shows as the best channel to achieve their goals, they do recognise and at times prefer alternative formats. Shows that traditionally operate as buying forums are potentially at risk, and in fact 15% of visitors see online marketplaces as better ways to buy/source products, with this rising to 29% amongst under 24’s. Similarly, learning about the industry is facilitated by other channels such as trade media, conferences and social media, with only 34% who say trade shows are the best way to achieve this goal. Those aged under 34 and women of all age groups are more likely to prefer social media as a channel to find new ideas and innovation. It is important to note that whilst survey respondents said they expect their trade show attendance to remain stable, they expect to increase their use of all other media channels, potentially putting more pressure on the trade show model. Many organisers however, see this as an opportunity rather than a threat as trade shows partner with other channels to attract visitors, or become content creators themselves. Organisers refer to a desire to create communities around their events and provide content 365 days a year. However, some express concern that to be successful at this the structures and skill sets within their organisations will need to evolve beyond one designed to deliver a trade show over a period of a few days. Download the full report here.